

Back to Special Report Table of Contents
[Print version of this article]
“Methods” of Climate Alarmists
by Benjamin Deniston
Aug. 3, 2015—Looking at the activity of proponents of the man-made climate change catastrophe narrative, we are left to ask about their apparent methodology – if the experimental or observational data does not match the model, why not just change the data?
This brings to mind the statements of some of the founding fathers of the man-made climate change catastrophe scare. Dr. Stephen Schneider, who was one of the early leading advocates of the need to stop a supposed man-made global warming catastrophe in the 1980s (after having warned of an imminent threat of man-made global cooling in the 1970s). Schneider was the founder and editor of the journal Climatic Change, author or co-author of hundreds of papers on climate change, a coordinating lead author in the IPCC's 2001 Third Assessment Report, and a consultant to many US presidential administrations. In a 1989 article in Discover magazine, Schneider was quoted discussing the “method” needed by climate alarmists:
On the one hand, as scientists we are ethically bound to the scientific method, in effect promising to tell the truth, the whole truth, and nothing but. … on the other hand, we are not just scientists but human beings as well … we need to get some broad-based support, to capture the public’s imagination. That, of course, entails getting loads of media coverage. So we have to offer up scary scenarios, make simplified, dramatic statements, and make little mention of any doubts we might have… Each of us has to decide what the right balance is between being effective and being honest.[fn_1]
Dr. Schneider had been a participant in a 1975 “endangered atmosphere” conference organized by Margaret Mead, herself a leading advocate of population reduction.[fn_2] At that conference (which included other soon-to-be leading climate alarmists, including the man who later became Obama's science adviser, John Holdren) Mead used her keynote address to express her promotion of this “method”:
What we need from scientists are estimates, presented with sufficient conservatism and plausibility but at the same time as free as possible from internal disagreements that can be exploited by political interests, that will allow us to start building a system of artificial but effective warnings, warnings which will parallel the instincts of animals who flee before the hurricane, pile up a larger store of nuts before a severe winter, or of caterpillars who respond to impending climatic changes by growing thicker coats.
Recognizing this “methodology” at the roots of the entire movement claiming we're facing imminent catastrophic effects from mankind's CO2 emissions, puts some recent cases of data manipulation and “adjustments” to historical data records in an interesting perspective.
Case 1 – Hockey Stick and Disappearance of the Medieval Warm Period
Much of the narrative that human CO2 emissions are taking us to a point of catastrophic climate change has been supported by claims that recent warming is “unprecedented.” If indeed the recent warming had no precedent in recent periods of natural changes, then it would make sense to look for what new (possibly man-made) influence might be causing this deviation from prior natural trends (e.g., recent increases in CO2 and other emissions).
However many records of past climate have consistently shown that there was a time about 1,000 years ago when temperatures were near current levels, if not warmer. The existence of this “medieval warm period” posed such a challenge to the notion that present warming is “unprecedented,” that it was disappeared.
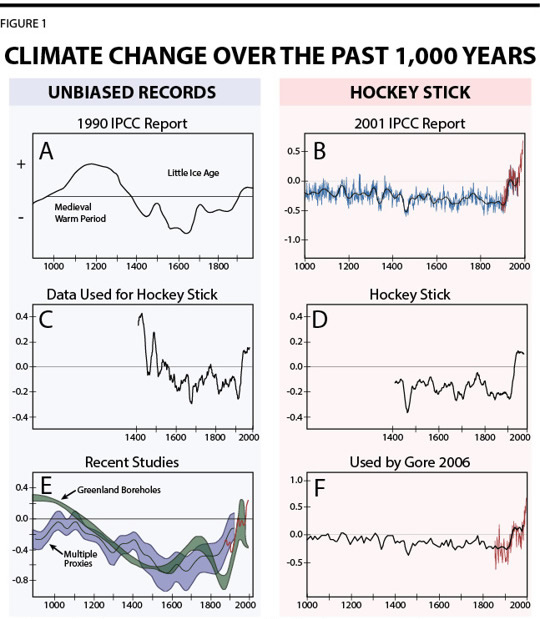
Despite being well recognized enough to be in the IPCC's 1990 First Assessment Report as the leading schematic diagram of natural climate change over the past 1,000 years (see Figure 1, Box A), by the release of the IPCC's 2001 Third Assessment Report the medieval warm period was conveniently gone. The new presentation of climate change over the past 1,000 years depicted a much flatter and more stable representation of past global temperature, with the only large deviation being a dramatic increase in temperature during the 20th Century (see Figure 1, Box B).
This new presentation of past climate became the go-to illustration to show how “unprecedented” recent climate change has been – proof that mankind must be the factor responsible for this otherwise anomalous deviation from the stable trend of prior centuries.
The only problem with this reassessment of our understanding of the past is that it is ridiculously untrue.
The statistical methods used to produce the new presentation of past global temperature were inherently biased towards producing a flat trend-line followed by a sharp increase – resembling a hockey stick (see Figure 1, Box D). In fact it was shown that if this statistical method was applied to a completely random data set it would produce the same hockey stick effect. When analyzing the exact same data with proper methods, the hockey stick character goes away, the medieval warm period returns, and the 20th Century is no longer unprecedented (see Figure 1, Box C).[fn_3]
The IPCC and other alarmists have rejected hundreds of accounts of the medieval warm period in favor of adopting the story presented by a study based on ridiculously dubious methods – because it fit their desire to “offer up scary scenarios.”
Despite this fraud being revealed by 2003, the hockey stick (or similar depictions) continued to be used, and alarmists continued to claim that recent climate change is unprecedented. For example, Al Gore used a similar depiction in his movie, An Inconvenient Truth (see Figure 1, Box F) – a film that was delivered to school teachers across the UK to be used in their curricula.
Recent studies have continued to show the existence of the medieval warm period (see Figure 1, Box E), and while debate continues as to whether it was warmer than the present, the scare-story narrative that the climate change over the past century is unprecedented and dramatically different from historical records is ridiculous.
Case 2 – Adjustments of Historical Records and the Elimination of the Pause
It is a difficult challenge to derive a single measure for average global temperature – and not just for past periods (going back thousands or millions of years), but also for recent periods, where we have direct measurements from instruments. Many different measurements – taken in different locations, at different times, and with different instruments – have to be weighted, combined, and averaged in order to provide a single value.
With such an undertaking it is no surprise that prior assessments might get changed and adjusted over time (as methods of analysis might improve or more measurements might become available). However, for those supporting the claim of a coming man-made climate change catastrophe, the adjustments are consistently biased towards supporting their claims. Let’s look at a few examples.
When was the hottest period of the past century? The answer to that question would depend upon what region you are talking about, but it would also depend upon when you asked that question. For example, in 1999 Dr. James Hansen (then head of the NASA Goddard Institute for Space Studies, which focuses heavily on climate change) authored an article on climate change which utilized a graphic of the official US government assessment of average temperature change in the United States over the past 120 years.[fn_4] By the 1999 figures it was recognized that 1998 was a hot year, but 1921, 1931, 1934, and 1953 were all recorded has hotter years for the United States, with 1934 being over a half a degree (Celsius) hotter (Figure 2, Box A).
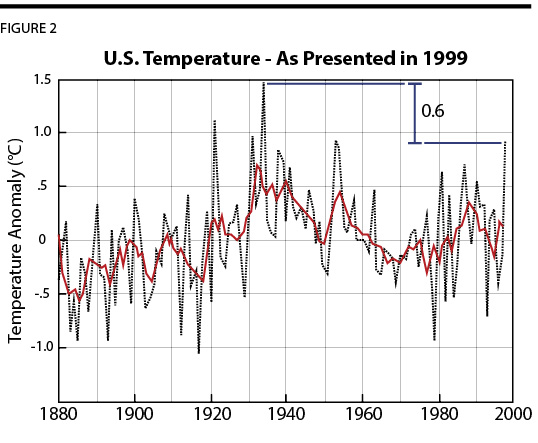
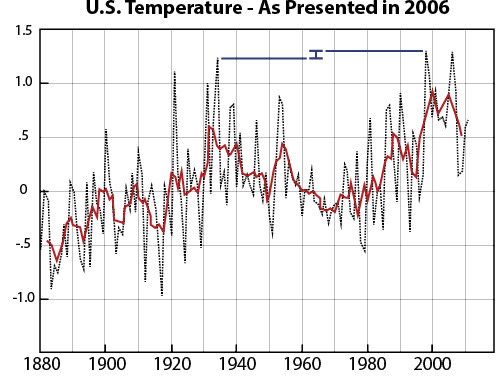
However, if we examine the records provided by NOAA and NASA today the assessment of temperatures in the past have been adjusted to lower values, with 1921, 1931, 1934, and 1953 all becoming cooler than 1998.
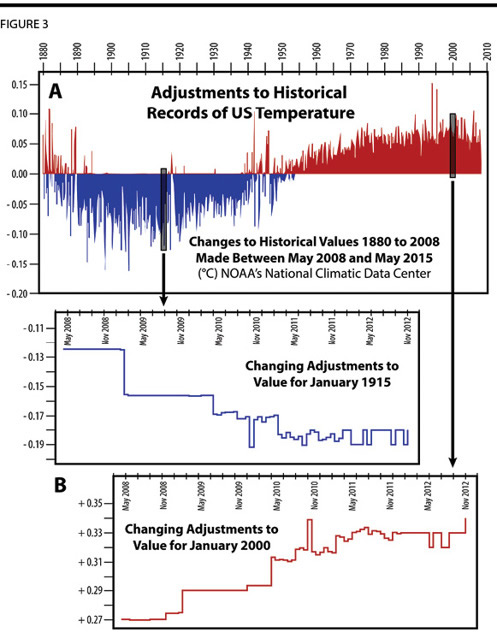
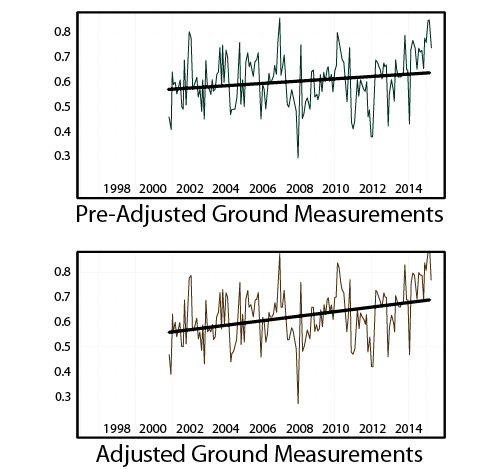
Such convenient adjustments are not limited to the historical records of temperature in the United States. Professor Ole Humlum has analyzed the many adjustments made by the US government’s official records of global air surface temperature (produced by NOAA’s National Climatic Data Center). Through a series of adjustments between May 2008 and February 2012, the official historical records of global temperature in the first half of the 20th Century have been systematically adjusted cooler, and more recent temperatures systematically adjusted hotter – accelerating the claimed measured rate of warming solely by adjusting what instrument records were supposed to have said about the past in 2008, versus what the same instrument records were supposed to have said about the past in 2012.
Figure 3A depicts the cumulative adjustments to the historical global temperatures between 2008 and 2015, and Figure 3B analyzes just two specific months, January 1915 and January 2000, examining how the historical values of those two dates changed with each adjustment made between 2008 and 2012.
Most recently, NOAA has released a new revised data set of adjusted global temperatures, leading to new claims of increased warming. Again, this is not showing that the latest data from recent months shows more warming, this is adjusting the assessments from prior years, and changing what they claim the past was.
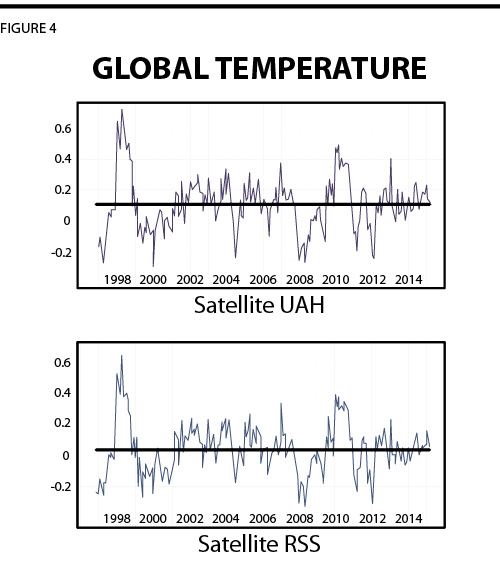
Whereas two assessments of global average temperature based on satellite measurements have shown that global temperatures have not increased for nearly two decades, a new paper utilizing adjusted values from NOAA (based on the combination of various land and ocean surface measurements) claims to show that temperatures have been increasing over the past two decades.[fn_5] A section from their abstract reads, “The central estimate for the rate of warming during the first 15 years of the 21st Century is at least as great as the last half of the 20th Century.” This flatly contradicts the results provided by two assessments based on satellite measurements, but conveniently fits the narrative of the alarmists.
In one sense, man-made warming is unarguably real: it is created not by CO2, but rather by “adjusting” the temperature records.
Taken together, these manipulations of past climate records – and the way these manipulations have been used to scare the public – shouldn’t be much of a surprise. In the 1970s and 1980s Margaret Mead and Stephen Schneider already told us how the climate alarmists were going to operate, and these more recent data manipulations are just a few examples of their “methods.”
[fn_1], S.H. Schneider, In J. Schell “Our Fragile Earth.” Discover (Oct. 1989), pp. 45-48. [back to text for fn_1]
[fn_2]. “The Atmosphere: Endangered and Endangering,” 1975 conference in Research Triangle Park, North Carolina. [back to text for fn_2]
[fn_3]. “The Atmosphere: Endangered and Endangering,” 1975 conference in Research Triangle Park, North Carolina. [back to text for fn_3]
[fn_4]. “Whither U.S. Climate?” James Hansen, Reto Ruedy, Jay Glascoe and Makiko Sato, http://www.giss.nasa.gov/ August 1999. [back to text for fn_4]
[fn_5]. “Possible artifacts of data biases in the recent global surface warming hiatus,” Karl et al, Science, June 2015. [back to text for fn_5]

